
EtherExpert-TGA

Cutting-Edge Network Traffic Generator and Analyzer
L2-L3+ | 1-100 Gbps Wire Speed | Multi Streams | Web Based
Replicate real‑world network conditions with nanosecond precision, seamless automation, and deep visibility—ensuring your applications, protocols, and devices perform flawlessly under any challenge.
Key Features
High-performance traffic generation and deep analysis capabilities
Hardware Based Traffic Generator
Purpose-built hardware for wire-speed packet generation with precision timing
1/10/25/100 Gbps at Line Rate
Collaborative testing with accessible web interface from anywhere
Multi-user Web-based UI
Full line-rate traffic generation across all supported port speeds
Up to 1024 Traceable Flows
Real-time validation with extensive flow tracking capabilities
REST APIs for Test Automation
Scale your testing infrastructure with modular, stackable design
High Density Stackable Solution
Seamless integration with CI/CD pipelines and automated test frameworks
1/10/25/100 Gbps Ethernet IP Traffic Generator and Analyzer
The Network Traffic Generator and Analyzer is a high-performance test solution designed for validating Ethernet networks, devices, and applications across speeds ranging from 1G to 100G. It provides both traffic generation and deep analysis capabilities, making it ideal for benchmarking, functional verification, and performance testing of networking equipment.
Stream-oriented Traffic Generation
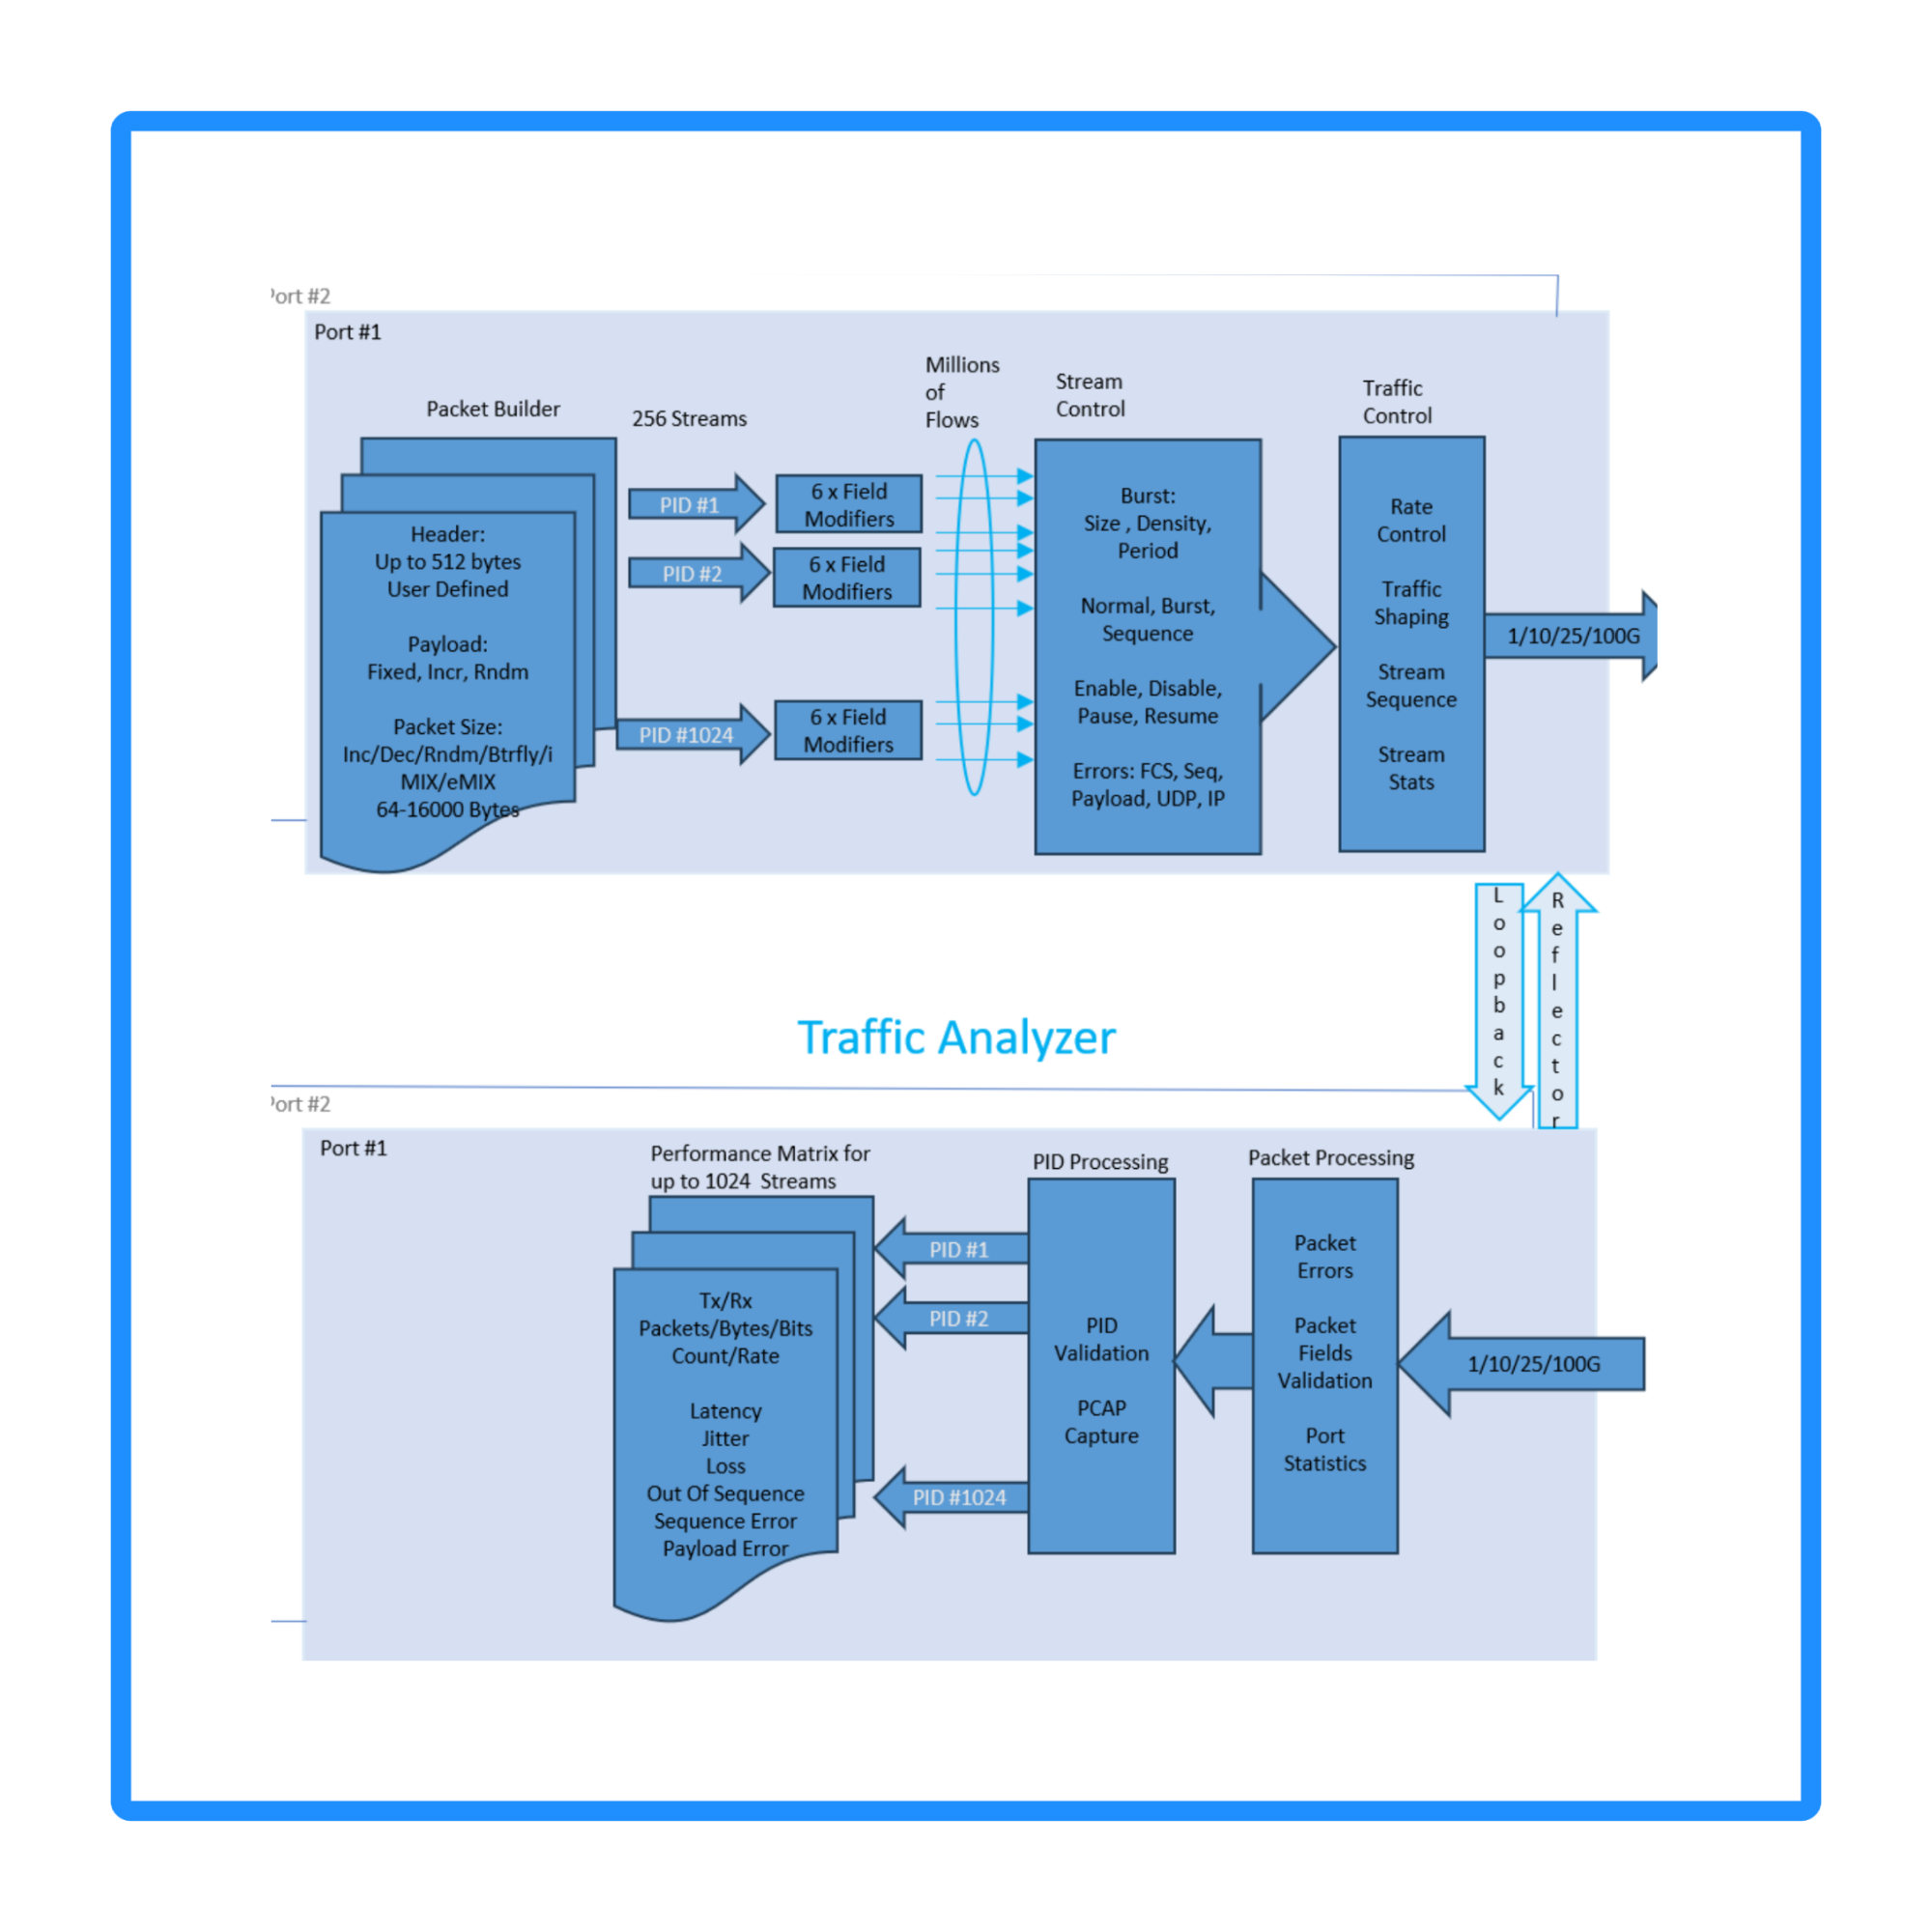
Wire-speed packet generation with timestamps, sequence numbers, and data integrity signature optionally inserted into each packet
Define and Generate traffic Up to 256 streams at wire speed
Supports customizable headers up to 512 bytes including Ethernet, Ethernet II, VLAN, ARP, IPv4, IPv6, UDP, TCP, GTP, ICMP, SIP, RTP, RTCP, STP, MPLS, PBB, or RAW (fully specified by user)
Each stream can generate millions of unique traffic flows using multiple packet field modifiers by programmable increment, decrement or randomize field values such as MAC address, IP Address or Port Numbers
User defined stream rates as percentage of line rate or packets per second
User defined Traffic profile as burst or uniform
User defined Custom Packet Header per stream using easy to use Packet Header Builder
Programmable frame lengths (fixed, incremental, random, IMIX, EMIX, butterfly)
Diverse payload types such as user-defined patterns, incremental and PRBS31
Error insertion at multiple protocol layers (IP, UDP, FCS, PID), Payload and Link-flip allows realistic stress and fault testing
Delivers comprehensive visibility into network performance and quality of service
Packet flow statistics per stream
Incoming packet streams auto identified using Test Payload fields inserted during transmission
Real-time per-stream analysis of traffic throughput, jitter, loss, sequence and drop errors with nano second accuracy
Wire speed packet capture on each port for offline analysis
Supports up to 1024 traceable flows with real-time validation of IP/UDP checksums, PID integrity, and frame check sequences
Advanced Performance Metrics per received stream including Frame Transfer Delay (Latency), and Frame Delay Variation (Jitter) for precise characterization
Frame/byte counters, payload integrity error, packet sequence error and packet mis-order detection
Real-time Analysis and Reporting
The system adapts seamlessly to a wide range of testing environments — from device R&D labs to carrier-grade network validation. It combines high-fidelity traffic generation with robust analysis capabilities, enabling users to confidently assess throughput, latency, jitter, error behavior, and resilience of modern Ethernet networks.
Intuitive Web-Based Interface
Feature-rich, easy-to-use software designed for network engineers—accessible from anywhere
Software Interface

Screenshot of Packetronix Traffic Generator interface with stream capture settings open, showing port configuration, stream capture options, and a green button labeled 'Capture & Download'.

Screenshot of a traffic analysis dashboard with various line and bar graphs showing network data over time.
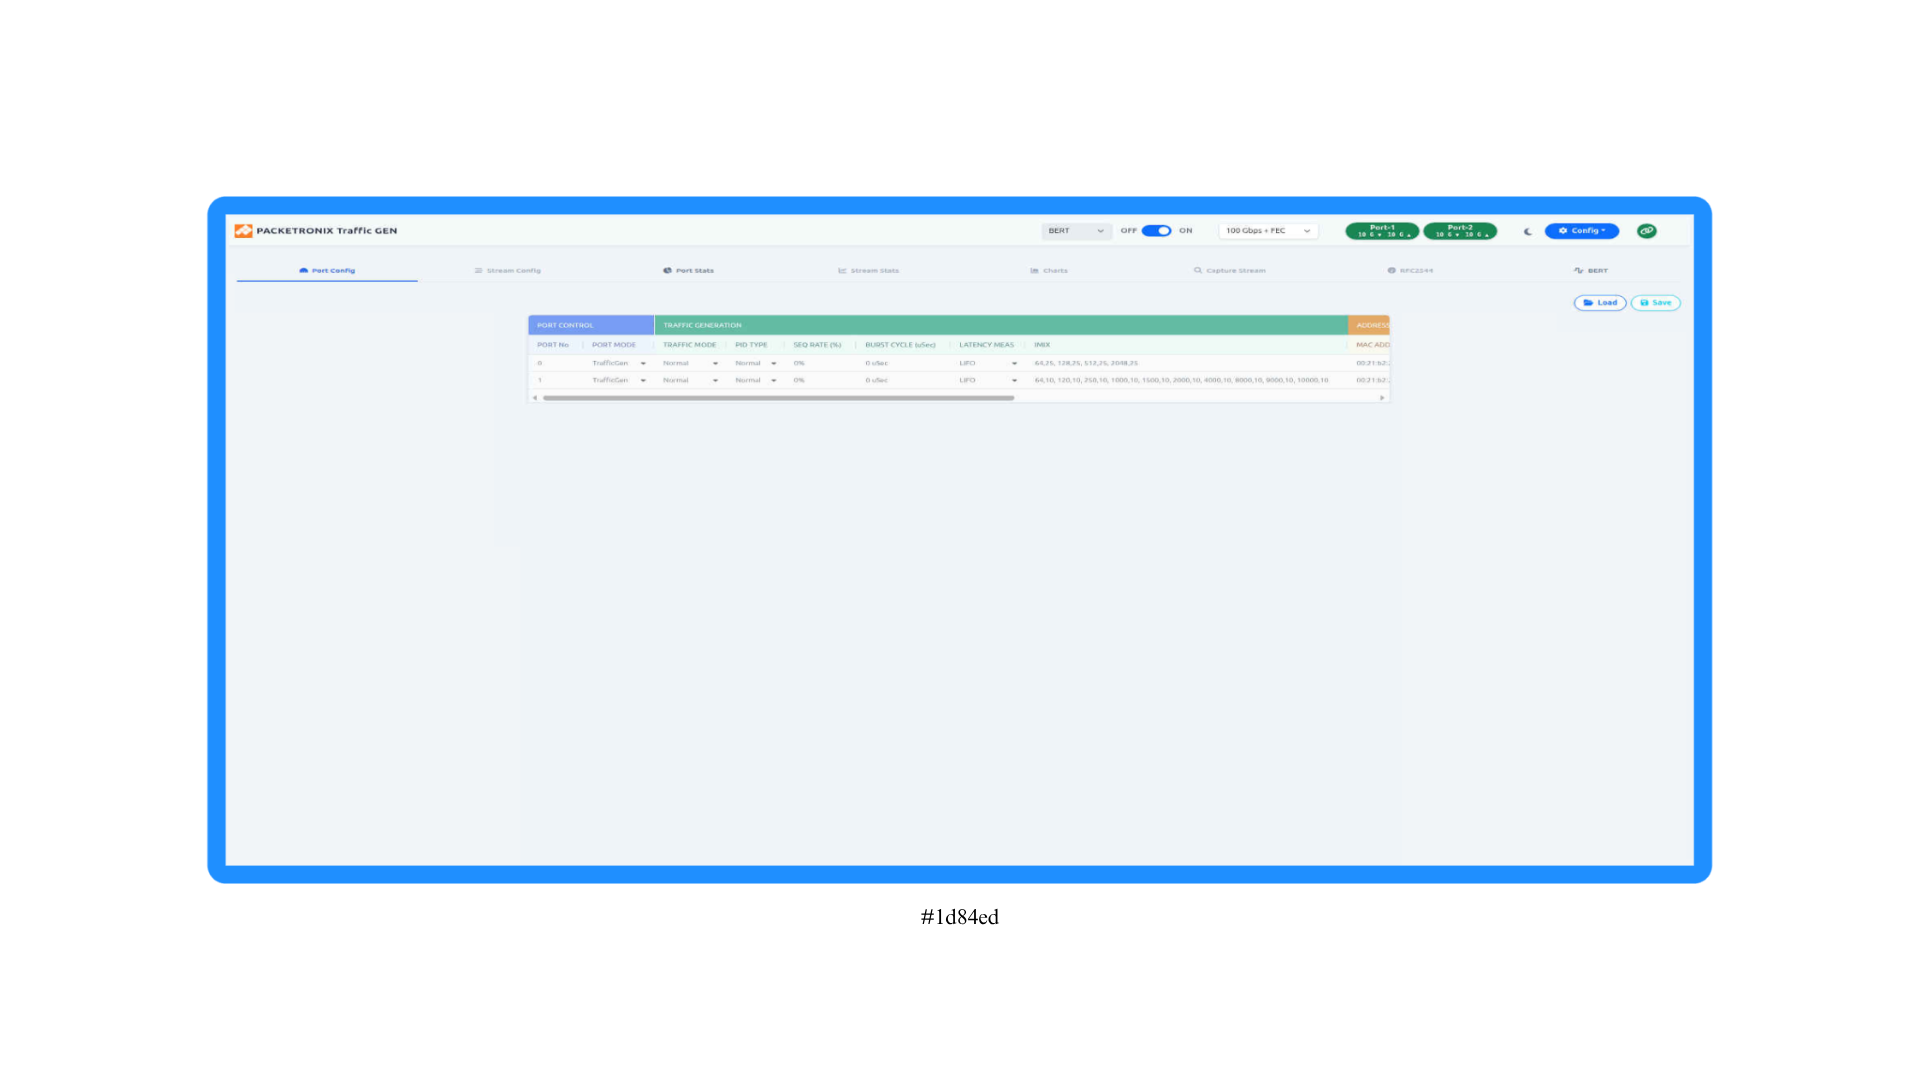
Screenshot of a network traffic management interface labeled 'PACKETRONIX Traffic GEN,' showing port configuration details for port 1 with traffic generation settings, port mode, traffic mode, PID type, SEO rate, burst cycle, latency measures, and MAC address, with options for load, save, configure, and stream capture.
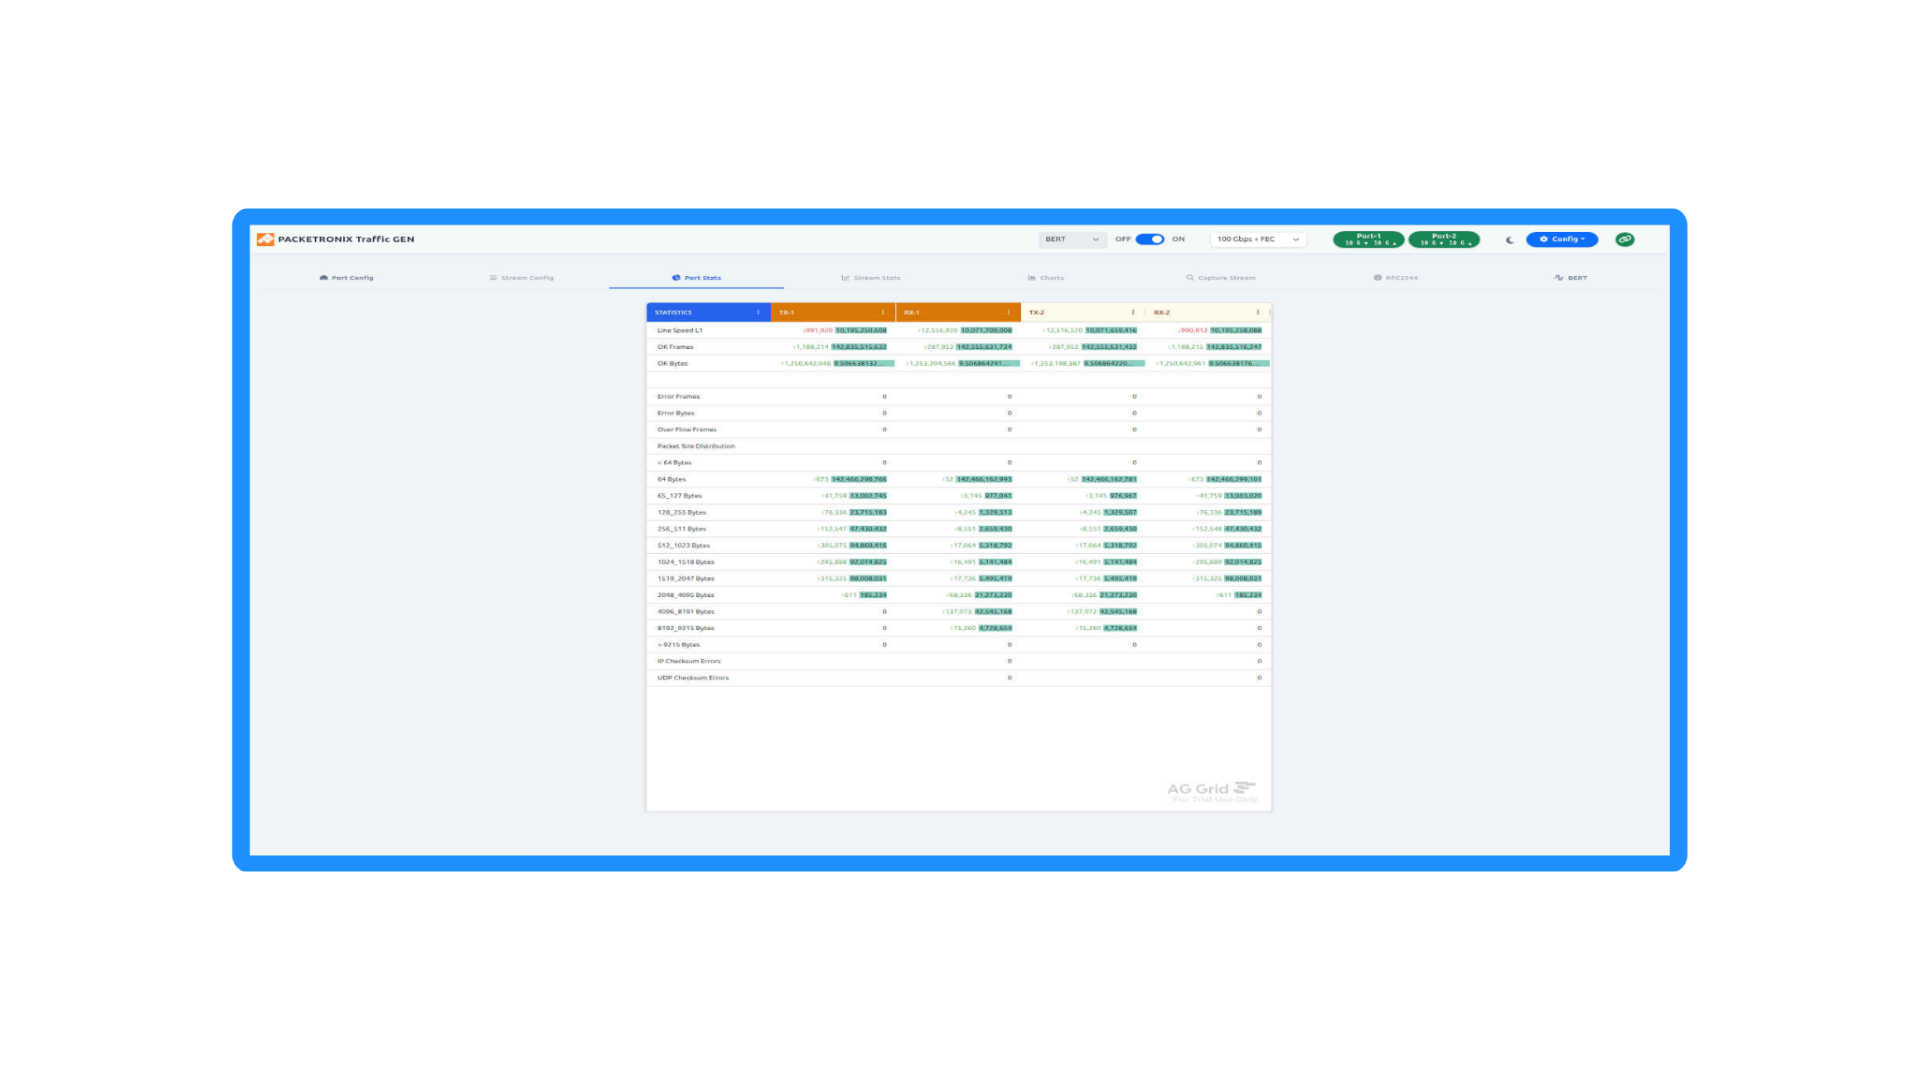
Screenshot of a network traffic analysis dashboard showing port statistics, data transfer rates, and packet information for network ports, with options for configuration and traffic filtering.

Screenshot of network traffic data from Packetronix Traffic GEN software, displaying detailed statistics on stream QoS Rx and Tx, including throughput, packet loss, and delay metrics for multiple ports and streams.
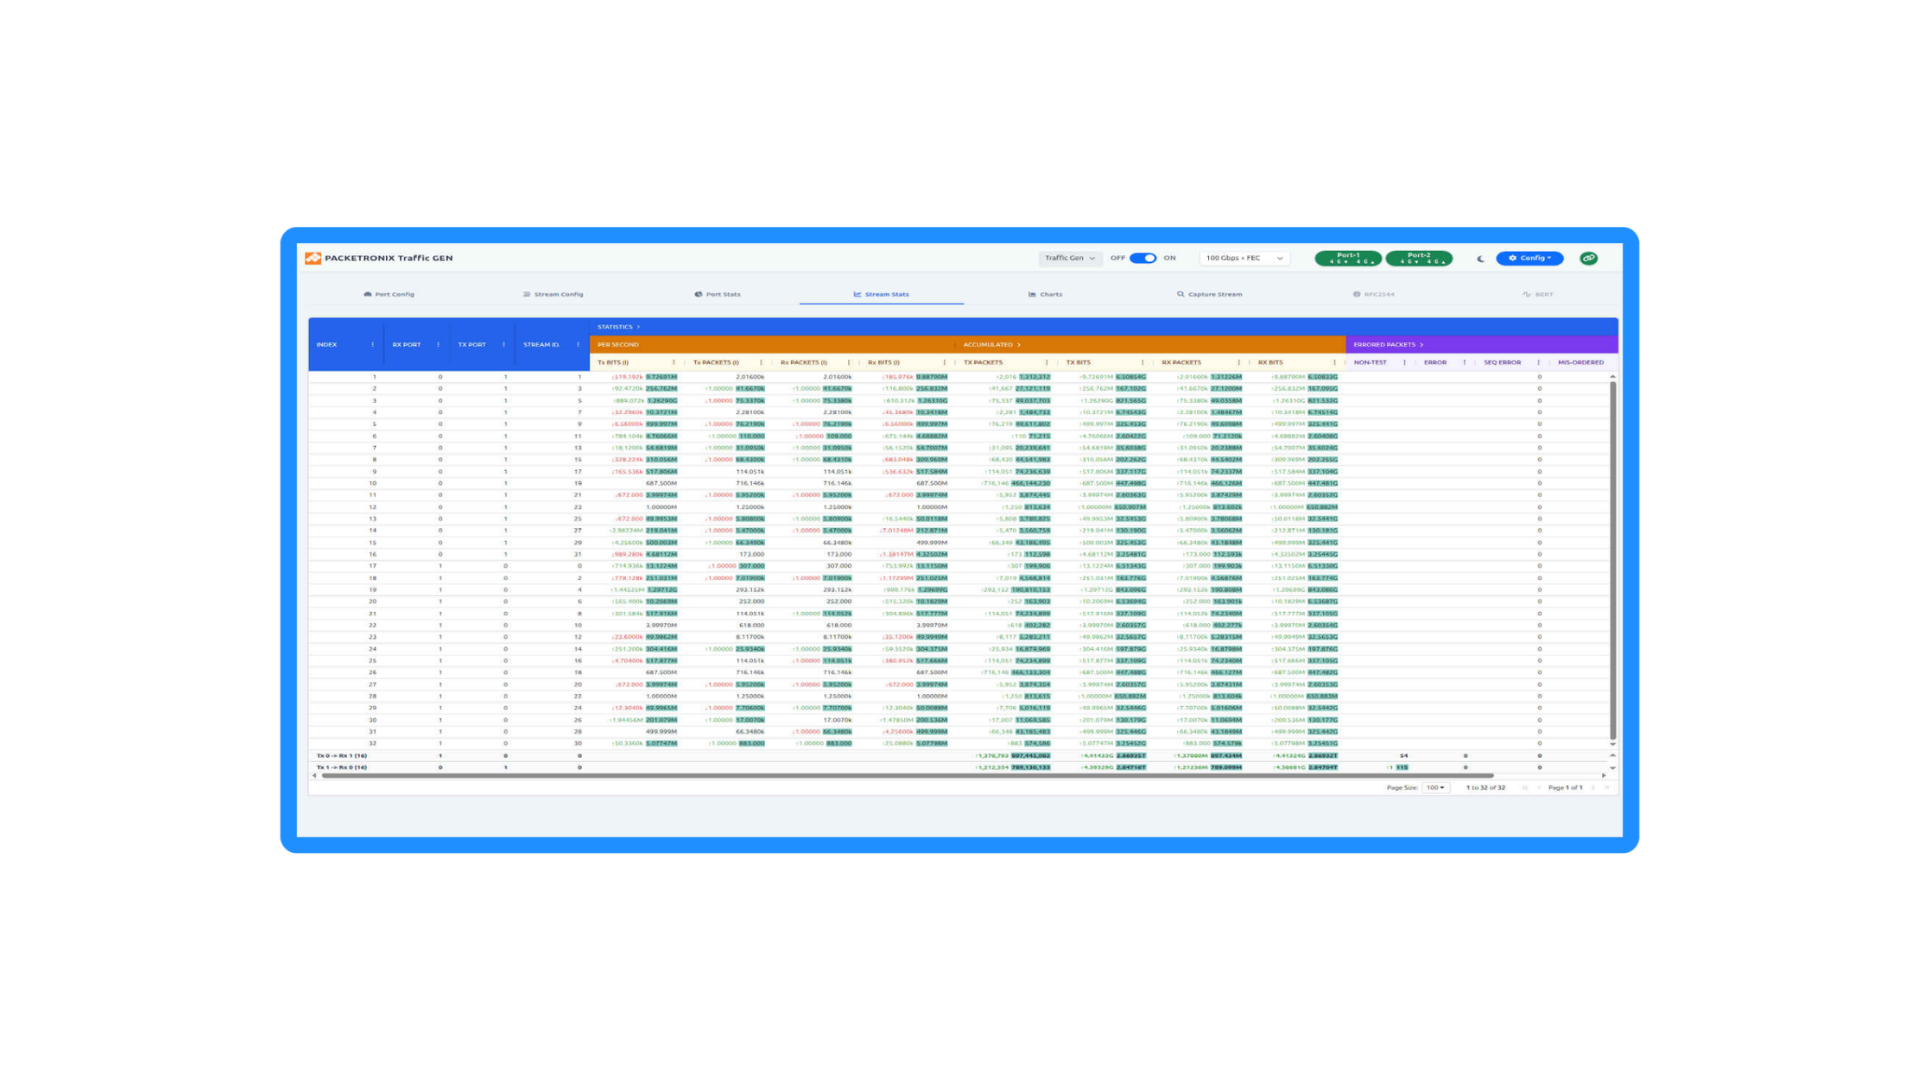
Screenshot of Packettronix Traffic Generator software showing network traffic data and statistics with table columns including index, RX port, TX port, stream ID, per second data, accumulated data, and error packets, along with toggle switches and menu options.

Screenshot of PACKETRONIX Traffic GEN software interface showing port configuration, stream control, protocol header configuration, and network traffic details with IP and Ethernet protocol data.

Screenshot of PACKETRONIX Traffic Generator software interface showing stream configuration and traffic control settings for network ports.

Screenshot of a protocol header configuration interface with a layer set to Ethernet, displaying destination and source MAC addresses, and options to add a layer, clear all, cancel, or apply changes.

Screenshot of Packetronix Traffic Generator software with network port configuration and stream control settings displayed.

Screenshot of Packetronix Traffic Generator software interface showing stream configurations with multiple port settings, stream actions, and error messages.

Computer screen displaying network management software with multiple error messages and status indicators.
Use Cases
End User Industries
Network Equipment Manufacturers
Network Service Providers
Finance, Energy and Utility
Education
Semiconductors
Devices Under Test
Network Equipment Manufacturers
Wireline and Wireless Networks
Routers and Firewalls
Packet Brokers and Analyzers
Network Interfaces
Types of Testing
Performance
Functional
Security
EduQoS, SLA and Quality Assurance
Convergence
Specification
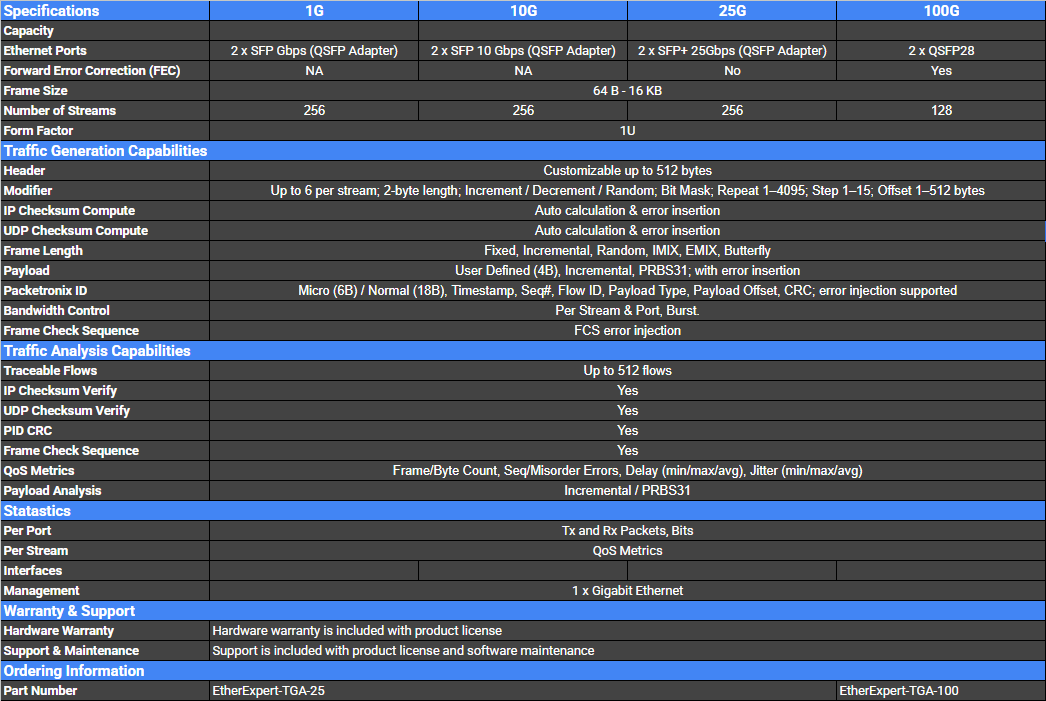
Technical specifications for the Network Traffic Generator and Analyzer
Frequently Asked Questions
-
How many concurrent streams and unique traffic flows can the system generate?
-
To replicate diverse production environments, you can configure your traffic profiles as either burst or uniform, with rates specified as a percentage of the total line rate or exact packets per second. Frame lengths can be customized heavily using fixed, incremental, random, IMIX, EMIX, or butterfly distributions.
-
Yes. Using the built-in Packet Header Builder, users can construct custom headers up to 512 bytes. The system natively supports a massive array of protocols across layers, including Ethernet II, VLAN, ARP, IPv4, IPv6, UDP, TCP, GTP, ICMP, SIP, RTP, RTCP, STP, MPLS, PBB, or completely RAW user-specified data.
-
The system automatically identifies incoming streams using proprietary Test Payload fields inserted during transmission. It provides real-time validation for up to 1,024 traceable flows, tracking critical metrics like Frame Transfer Delay (Latency) and Frame Delay Variation (Jitter) with nanosecond accuracy, alongside hardware-level frame/byte counters and mis-order detection.
-
Yes. Instead of capturing all line-rate data, you can configure precise, user-defined capture filters for each port. The platform supports granular filtering criteria, including:
Layer 2: MAC Addresses, EtherTypes, and specific VLAN Ranges.
Layer 3 & 4: IPv4/IPv6 networks using CIDR notation, Protocol types, and specific Port Ranges.
This ensures you only capture the exact packets relevant to your test case, saving storage space and reducing analysis overhead.
-
The platform provides dual-method analysis. You can perform quick, immediate inspections directly within the built-in web interface for fast debugging. For deeper, compliance-level packet inspections, you can instantly download the captured data as an industry-standard PCAP file for offline analysis in tools like Wireshark.
-
To help you identify transient spikes and latency patterns at a glance, the interface generates real-time, highly visual Jitter Distribution Graphs. Crucially, you can overlay data from multiple streams simultaneously, allowing you to compare Quality of Service (QoS) behavior and pinpoint performance degradation across different traffic classes in real time.
-
Yes. Every port supports wire-speed packet capture. Engineers can capture live traffic directly through the web interface and download it for offline deep-packet analysis in industry-standard tools like Wireshark.
-
You can insert errors across multiple layers—including IP, UDP, FCS, and PID checksums—as well as direct payload corruption and link-flap simulations to rigorously stress-test the fault-tolerance and error-recovery behavior of your Devices Under Test (DUTs).
-
Is the software locally installed, or can it be managed remotely?
A: The platform features an intuitive, multi-user web-based interface that is completely responsive and accessible from anywhere via a browser. Multiple engineers can collaborate, configure ports, and view real-time analysis simultaneously without needing localized client software.
-
The system is built with a developer-first approach, exposing comprehensive REST APIs for complete test automation. This allows QA and DevOps teams to seamlessly integrate traffic generation, error insertion, and statistics collection directly into automated testing pipelines.
Ready to Transform Your Network Testing?
Get in touch with our team to discuss your requirements and see how Packetronix can accelerate your deployment timelines.